What the published data actually shows
Each of these comes out of the same pipeline that feeds the tool. Every figure traces to a published file, and anything inferred says so.
About 550 MW of batteries are running that no market register can see
10 documented operating batteries, named from owners' own project lists and supplier case studies, that appear in no balancing dataset we read, with the mechanism that hides each one.
Read it →
What Ireland’s batteries do and how they earn
A free 22 page report on the batteries that trade in the all-island electricity market, from the market operator’s records and the companies’ own accounts.
Read it →Irish batteries discharge about once a day. British batteries discharge about four times a day
The same 54 days of meter readings for every grid battery on the island of Ireland and every one in the balancing mechanism in Britain. The Irish fleet works the morning and evening peaks and little else, 13 of its 23 working batteries charge at less than half the rate they discharge, and nine never pass 57% of their registered power.
Read it →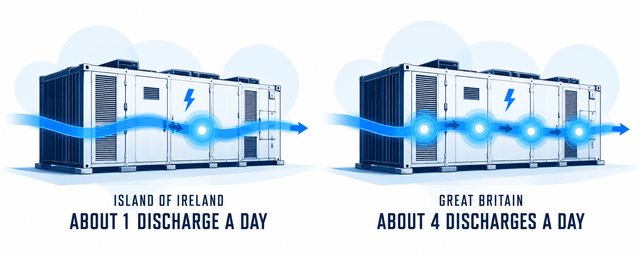
The busiest batteries are the worst at following the price, and nobody can tell us why
Twenty one days of half hourly positions for every battery in the balancing mechanism. Price response varies fifteenfold between equally busy sites. What predicts it is how often a battery changes direction. What causes that, we have tested six explanations and found none.
Read it →
Thirty five batteries that neither balancing nor reserve data can see
A third source found 35 battery sites holding 389 MW of capacity market agreements that appear in neither of the two sources everyone builds fleet figures from, ours included.
Read it →
No permitted battery capacity remains in any zone
NESO rations connections against the Clean Power 2030 targets. Queue formation allocated all of the battery allowance, and the published remaining figure is zero in all nineteen zones.
Read it →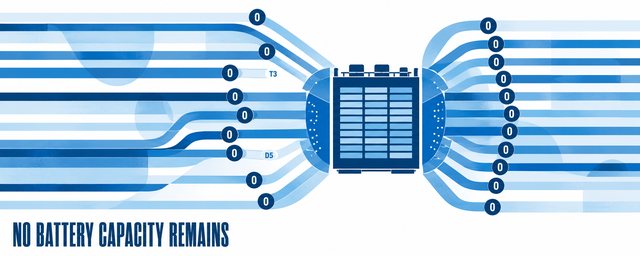
123 GW of the queue is contracted at connection nodes with no published location
122 strategic connection nodes created by the connections reform hold 123 GW of contracted storage between them. No published source places any of them, and they hold not one megawatt of Gate 2.
Read it →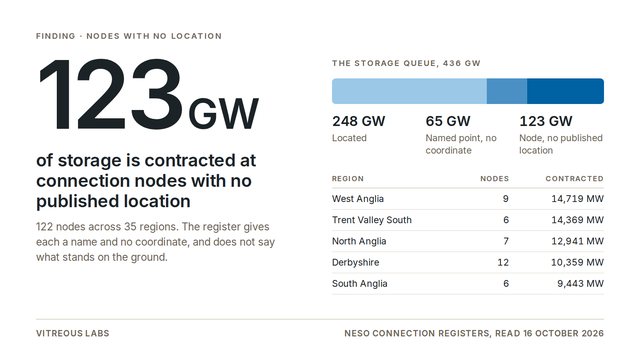
A battery in North Scotland is turned down 41 times as often as it is turned up
A full year of Elexon settlement data across the traded fleet shows a north to south gradient: the further north an asset sits, the more the system uses it as a sink and the less it earns. Two small English zones interrupt it.
Read it →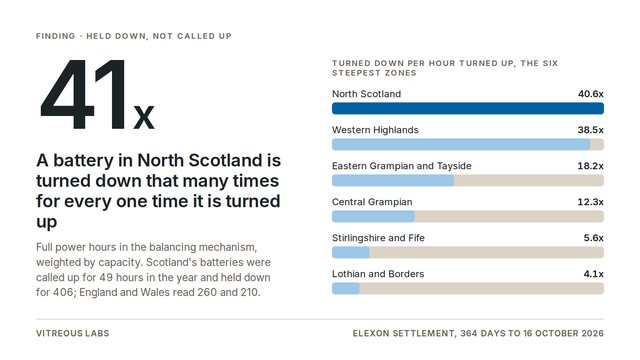
Only 23 queue applicants are also balancing mechanism lead parties, and they hold 80 MW of Gate 2
23 companies in the connection register are the same registered entity as a balancing mechanism lead party. Between them they hold 80 MW of Gate 2, at 2 applicants.
Read it →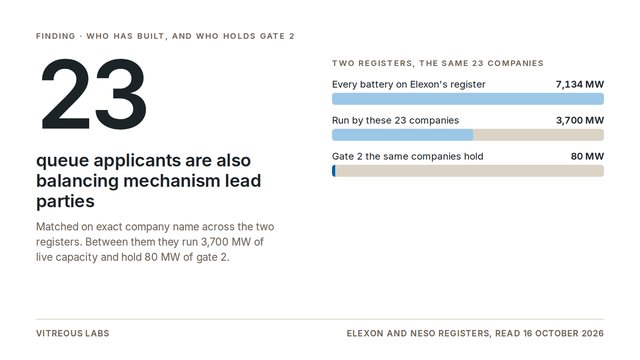
The company that sells a battery’s power usually does not own it
We followed the control filings behind every operating battery in Britain. On 118 of the 182 we can name, the company selling into the market is somebody else entirely. Coverage stands at 83 per cent of operating capacity.
Read it →
The four companies that sell the most battery power in Britain own none of it
73 per cent of the operating fleet's power is sold by a company with no stake in the battery. 21 sellers run two or more batteries and own not one of them, 4,716 MW between them.
Read it →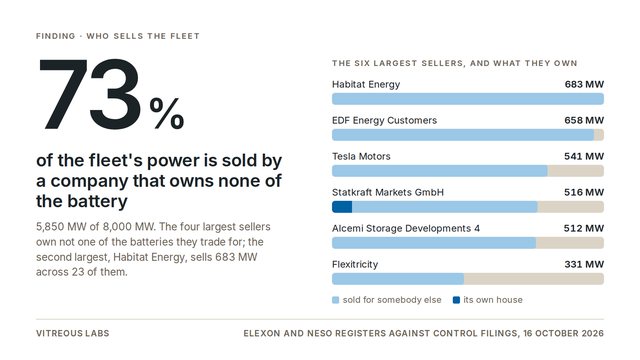
181 GW of the connection queue is not storage, and 6.8 GW of that carries a gate 2 flag
Storage is 70 per cent of what is waiting to connect. Offshore wind leads the rest at 87 GW. The register carries a gate 2 flag on 3.8 per cent of the non-storage queue, against 4 per cent of the storage queue.
Read it →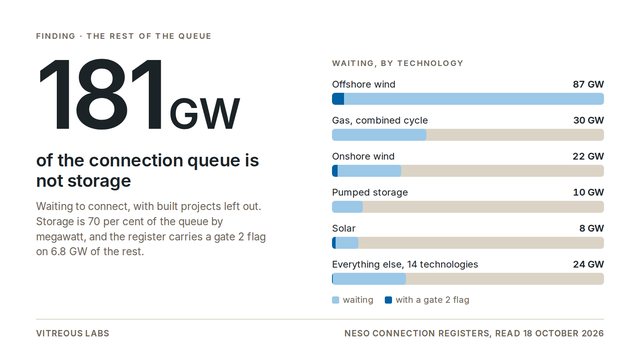
Battery duration has risen from 1.4 hours to 3.4
The capacity market de-rating classes state duration explicitly. Weighted by connection capacity, it has more than doubled across five delivery years.
Read it →
Every metered battery bought its power back below the market price
The balancing column shows batteries paying out millions. They are buying, not losing. Across 143 metered units the fleet paid £134.4m for 1,833,634 MWh that the market was pricing at £199.2m in the same half hours, and not one unit paid above the index on average.
Read it →